Part 2 of 4. Growing Crops with Limited Water in 2026
Not all drought years are alike. Looking back at recent drought years in the Nebraska Panhandle, 2002 and 2012, the yield outcomes for irrigated corn, dry bean, and sugar beet were very different. 2002 was dry weather and short canal delivery. 2012 was dry weather but canal delivery on the North Platte system was close to normal. 2026, so far, looks much more like 2002 than 2012 — which is why the historical yield comparison is worth a close look.
This is Part two of a four-part Crop Watch series recapping the April 8, 2026, Yonts Water Conference. Part 1 laid out the 2026 weather, ET, and soil-moisture picture. Here, yield data from USDA NASS (corn, dry bean) and Western Sugar Cooperative (sugar beet) are used to compare outcomes in 2002 (severe drought and severely reduced canal water), 2009 (wet-year benchmark with full delivery), and 2012 (dry weather but essentially full canal delivery) across four Panhandle counties: Box Butte, Morrill, Scotts Bluff, and Sheridan. Morrill and Scotts Bluff rely more heavily on surface-water delivery; Box Butte and Sheridan are mostly irrigated by groundwater. Note: USDA NASS county average yields do not distinguish between ground-water and surface-water irrigation, and chickpea is sometimes counted as "dry bean." The numbers below should be used for directional year-to-year comparison rather than as precise yield figures of ground- or surface-water based crop production.
Irrigated Corn Yields by County
USDA NASS survey data for irrigated corn in the four Panhandle counties (Table 1) show that in 2012, despite it being the drier weather year, irrigated corn yields were close to 2009 levels. In 2002, by contrast, irrigated yields dropped sharply — particularly in Scotts Bluff County (27% below 2009), which relies most heavily on canal water.
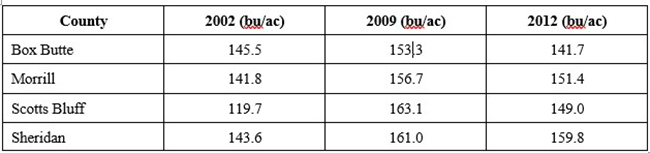
County-level average corn yields in 2002, 2009, and 2012 in Box Butte, Morrill, Scotts Bluff, and Sheridan. Source: USDA NASS.
Dry Bean Yields by County
Dry bean yields tell a similar story. 2002 dry bean yields were the lowest in this three-year window in all four counties. 2012 dry bean yields were actually the highest in Sheridan County, 2012 produced 3,040 lb/ac, well above 2009’s 2,250 lb/ac.
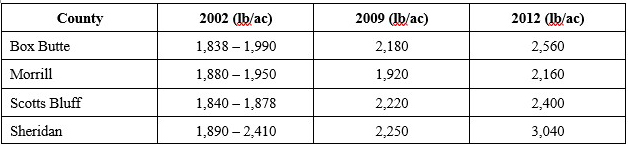
County-level average dry bean yields in 2002, 2009, and 2012 in Box Butte, Morrill, Scotts Bluff, and Sheridan. Source: USDA NASS.
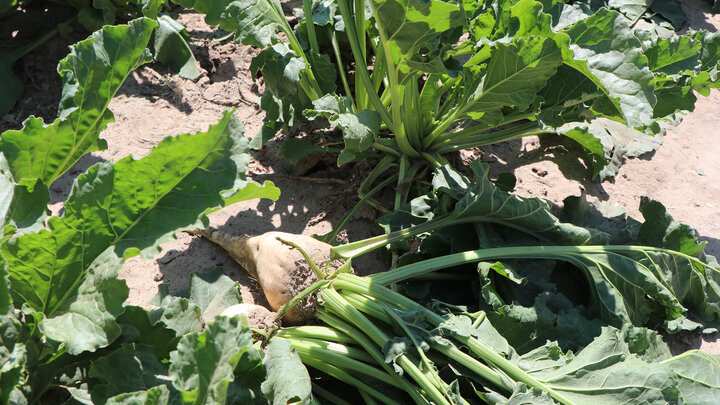
Sugar Beet Yields by County
The sugar beet numbers make the 2002-versus-2012 contrast even more dramatic. 2002 sugar beet yields averaged around 17-20 tons/ac across the four counties, the lowest on record for this period. 2012 yields, by contrast, averaged 27-32 tons/ac, among the highest on record. The sugar beet crop has a longer growing season than corn or dry beans and is most sensitive to early water stress. Therefore, early water delivery for sugar beet is crucial for proper emergence and crop development. When canal water is limited, it mostly affects early water delivery. It should also be noted that in 2002, rainfall from 4/15 to 6/25 was only 1.65, 1.06, and 2.20 inches at Alliance, Scottsbluff, and Sidney, respectively.
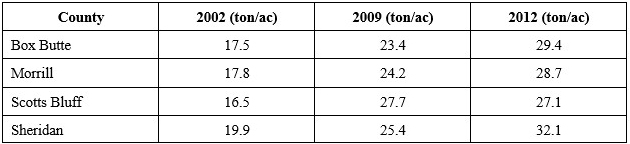
County-level average sugar beet yields in 2002, 2009, and 2012 in Box Butte, Morrill, Scotts Bluff, and Sheridan. Source: Western Sugar Cooperative
Takeaway for 2026 Planning
The 2002 vs. 2012 shows the importance of canal water to the Panhandle crop production: when canal water is available on schedule, even a dry weather year (2012) can deliver close-to-normal yields with proper management. When canal water delivery is short, as in 2002 and as projected in 2026, yield impacts are substantial, and sugar beet is the most exposed of the three crops.
Part 3 of this series breaks down why, using PREEC research plots, shows how each crop responds to limited irrigation. Part 4 provides the water-budget worksheet, crop-specific agronomic recommendations, and irrigation-system tips for the 2026 season.
Authors - Xin Qiao, Nebraska Extension Water Irrigation Specialist; Gary Stone, Nebraska Extension Water and Crops Educator; Saleh Taghvaeian, Jessica Groskopf, Nebraska Extension Agricultural Economics Cropping Systems Educator; Shuhua Xie, Post-Doctoral Research Associate; Joseph Oboamah, Graduate Research Assistant; Carlos Urrea, Nebraska Extension Dry Bean Breeder; Derek Heeren, Professor and Irrigation Engineer; Wei-zhen Liang, Research Assistant Professor; Abia Katimbo, Assistant Professor and Irrigation Engineer


